
by Steve Comeau on Jan 29, 2019 10:23:00 AM
A Data Historian is a type of time-series database designed to efficiently collect and store process data from a SCADA or automation system. The stored data can then be used to display trends of process data on charts, create reports, or perform data analysis.
Data points are configured for each measured item and assigned a tagname and other attributes. Historians log the data records for these points with a timestamp, a value, and a data quality indicator. The records are stored in a series of secure binary files that allow for fast retrieval of the records. 
Historians installed and configured by Hallam-ICS include the OSIsoft PI System, GE Proficy Historian, and the Rockwell Automation FactoryTalk Historian. These products are high-performance industry standard software and very well supported.
Standard Elements of a Historian System
A Historian system is composed of three primary components:
- Data collectors for interfacing with the data sources such as a PLC, networked devices, OPC servers, files, and other data sources.
- Server software that processes the data from the data collectors, stores the data, and serves the data to client applications. The server software components can also provide other services such as a calculation engine, alarm management, and subsystems to provide context for the data.
- Client applications for data reporting, charting, and analysis.
Optimizing Historian performance
The point configuration defines the parameters of the point, which determines how the data values are retrieved and stored. A point must be assigned a data type, such as float, integer, string, or blob. The point configuration defines the granularity of the data collection on x-axis based on time and on the y-axis based on signal value changes. The x-axis granularity is determined by scan rate configured or the scan rate in the OPC server if the point is configured to update “On Change” of the value.
The y-axis granularity is mainly determined by the configuration of two types of deadbands:
- The Exception dead-band is a simple vertical dead-band that will capture a value based on the difference between the new value and the previous value. The values that pass through this first dead-band are available as real-time data on live screens and charts; for additional processing and calculations; and for logging to the archive.
- The Compression dead-band is a sloped dead-band that has an algorithm designed to ignore values that fall within a sloped box. When a new value falls outside the sloped box, a set of values are logged and stored to the data archive.
The combination of scan rate and the two-stage deadbands achieves two performance goals of the data historian:
- Small changes to the signal that are deemed insignificant are filtered out and not stored; therefore much less drive space is needed to store the signal over time. The values stored approximate the trend of actual values, without needing to store each scanned value. The result is a clear signal without noise.
- Signal transients will be captured and stored.
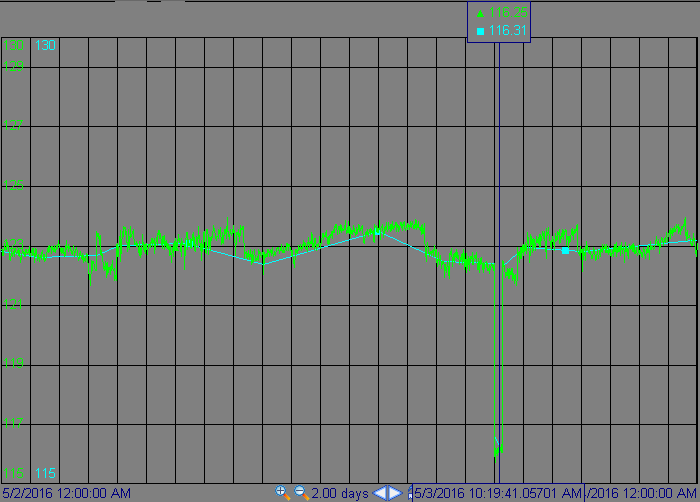
The green trace shows a voltage signal configured at a 10 second scan rate with no exception deadband and no compression. A value is logged every 10 seconds. The blue trace is the same voltage signal, also configured to a 10 second scan rate, but with an exception deadband of 0.5 volts and a compression deadband of 1 volt. Both points capture the low voltage transient to 116 volts. The green trace logs 8,640 values per day, the blue logs 3 values (minimum) or more per day.
It may be tempting to turn off the Exception and Compression filtering and simply log data based on the scan rate. For a 10 second scan rate, 8,640 values will be logged per day for each tag. On a small 2,000 tag system over 6 billion values will be logged per year. The argument for this approach is that drive space is cheap; yet large files sizes and file backups can be costly and time consuming to manage. A bigger concern is that the performance of the client applications which will chart and analyze the data will be slowed, resulting in lost time and frustrating user experience. The point configuration should be set in a way that addresses data requirements of the system and end users. Balance need for high signal granularity with the need for meaningful data and fast response of the client applications.

Hallam-ICS can help you with the installation and configuration of a data historian, and with reporting and data analysis solutions. Future blog postings will delve into other topics on data collection and data analysis that can be helpful in getting the most out of your data historian system.
If you would like more information about Data Historians you can contact Steve directly via email scomeau@Hallam-ICS.com or through our
About the Author
Steve has retired from Hallam-ICS, but his contributions to the company continue to be valued.
Read My Hallam Story
About Hallam-ICS
Hallam-ICS is an engineering and automation company that designs MEP systems for facilities and plants, engineers control and automation solutions, and ensures safety and regulatory compliance through arc flash studies, commissioning, and validation. Our offices are located in Massachusetts, Connecticut, New York, Vermont and North Carolina and our projects take us world-wide.


The Benefits of Turnkey Engineering Solutions: One Partner from Design to Commissioning

Vermont Service Day 2024 – Vermont Youth Conservation Corps

No Comments Yet
Let us know what you think