
by Steve Comeau on Jun 25, 2020 10:30:00 AM
In a manufacturing environment, there is frequently a need to report on very recent production data in a dashboard that displays “real-time” data. The data for the current day or previous day generally is the most frequently used and queried data. Using simple queries to obtain the data from dedicated tables allows the dashboards to update much faster with less loading on the database server.
Real-Time Tables
The data in the database is typically organized in a highly normalized structure that is not well-suited for report queries and may require joins to many tables and complex data transformations. In many cases, the database stores millions of records over a span of many years. The result can be complex and slow queries to obtain report data, even for a small set of the most recent records.
One solution to this problem is to build a small set of custom tables for real-time data and to create associated stored procedures to populate and update these tables periodically. Depending on the requirement for current data, a table update rate of every 1 to 15 minutes can work well. The stored procedure will be executed and read the source database tables once per time interval; therefore, the impact on the database server is minimal. Queries for report dashboards can frequently query the simple real-time tables and extract records, with essentially no delay.
Top reasons for using real-time tables:
- The tables used to store the raw data are not affected by user queries, since only the real-time tables are used.
- The data can be transformed and arranged in the table ready for use by the dashboard queries. This greatly simplifies queries used by the dashboards, which allows dashboards and reports to be created more efficiently.
- The dashboard queries will run much faster and can be queried often with very little impact on the database server.
Example Use Case – Production Line Data
In this use case, production line data is counted in 15-minute blocks. There are records for multiple production counters added to a data table every 15 minutes. A minute after the 15- minute block is complete, such as 00:01, 00:16, 00:31, and 00:46, the real-time table is updated by executing the stored procedure. This can be done using the SQL Server Agent or an external scheduling application. The stored procedure combines data from multiple tables and arranges the data in a table with one row per 15-minute block, with calculated columns for date, time, and contextual information; and a column for each numeric value needed for the dashboard.
Data arranged in real-time table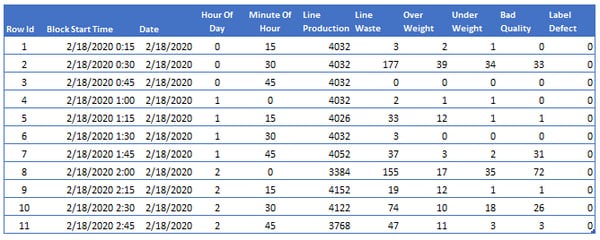
From the real-time table, the data can easily be queried in a reporting dashboard. Excel can connect to an SQL Server database and read the table directly into a table on a sheet, and the connection can be set to automatically refresh. The data can be transformed using Power Query to remove any unnecessary columns, add calculated columns, and group the records as needed, and then display in a worksheet table.
SQL Server Reporting Services can also be used to produce the dashboard that can then be viewed by many users using a web browser. The report can be set to automatically refresh at a preset interval. Most SCADAs also provide a means to easily query and report from a database. For example, Ignition SCADA by Inductive Automation® Perspective module can be used to provide a dashboard via a web browser and mobile devices.
Example dashboard using SQL Server Reporting Services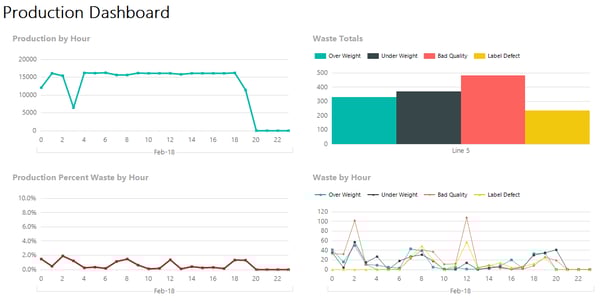
About the Author
Steve has retired from Hallam-ICS, but his contributions to the company continue to be valued.
Read My Hallam Story
About Hallam-ICS
Hallam-ICS is an engineering and automation company that designs MEP systems for facilities and plants, engineers control and automation solutions, and ensures safety and regulatory compliance through arc flash studies, commissioning, and validation. Our offices are located in Massachusetts, Connecticut, New York, Vermont and North Carolina and our projects take us world-wide.


What’s Your Favorite Way to Relax and Rebalance?

Tackling Riboflavin Residue Challenges in Cleaning Cycle Testing

No Comments Yet
Let us know what you think