
by Steve Comeau on Jul 16, 2020 10:30:00 AM

This is a blog post about totalizers! As simple as totalizers may seem, a lot can go wrong. There are many ways to get totals. Let’s look at some ways of calculating totals on the OSIsoft® PI System™ historian.
Calculating totals is common in control system and facility monitoring applications. Frequently this is accomplished using totalizers in devices such as PLCs or meters. Device totalizers are useful but can be difficult to incorporate into reporting since they may have unexpected resets; are not time synchronized to server systems; and may not provide the totals needed for reports. A better approach is to calculate totals in the data historian.
A totalizer calculation converts a rate or incrementing value to a usage value per unit of time, such as an hour or day. The result in each case is a usage quantity that is summable; therefore, you can sum up the amounts to obtain the volume or energy amounts used over the intervals of time. Here are some examples:
- A liquid flow rate in gallons/minute (gpm) is converted to volume in gallons
- Electrical power in kilowatts (kW) is converted to energy usage in kilowatt-hours (kWh)
- Cooling power in Tons of Refrigeration (12,000 btu/hr) is converted to energy usage in ton-hours
Another scenario where a totalizer is useful is to convert an incrementing counter into a daily count. Difficulties with device counters are that the counter can be reset manually at any time; may reset periodically but at the wrong time of day; or never resets and becomes a huge and hard to read number. By reading the device counter into a PI calculation, the counts can be converted into a reliable daily total, that provides a new value at the same time each day.
The PI System™ provides several methods for calculating totals:
- PI Point Summary Calculations
- PI Performance Equation (PE) tags
- PI Totalizer tags
- Asset Framework (AF) Analysis Expressions
- ACE calculation engine (ACE is not included in this evaluation)
Comparison of Totalizer Calculation Types
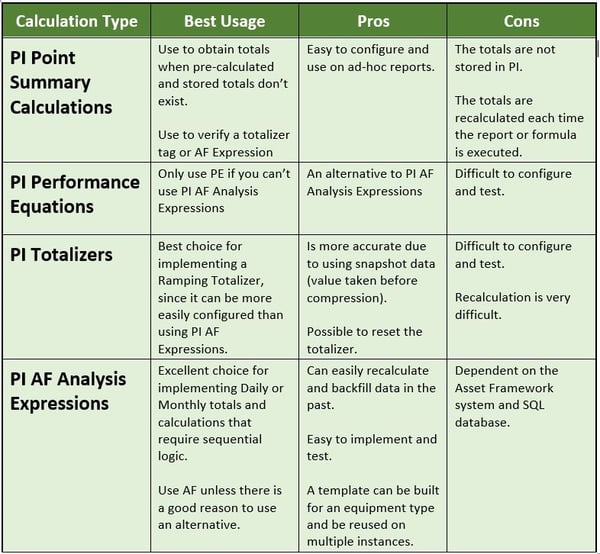
PI Point Summary Calculations
PI DataLink is an Excel add-in that can be used to extract data from PI using PI Point Summary Calculation functions. To obtain totals from a flow rate tag, use the time-weighted totals formula. PI gets the Integral under the flow rate curve to get the time-weighted total. Alternatively, use a time-weighted average multiplied by the number of time intervals, to get the same result.
PI Point Summary Calculations are useful for verifying totalizer tag and AF Expression calculations and for getting totals for points that do not have a totalizer calculation configured.
PI Performance Equation (PE) Tags
The PI Performance Equation subsystem is used to execute PI PE calculation tags. The PE provides a set of functions and operators that can be used to program PI tags to perform calculations. The same calculation functions using a similar syntax can be used in the Asset Framework (AF) Analysis Expressions.
PI Totalizer Tags
The PI Totalizer subsystem is used to create PI Totalizer tags and to calculate totals, averages, minimum and maximum values, standard deviations, and counts. The Totalizer uses snapshot data, which is the data available before the compressed data is stored to the data archive. Therefore, the totals obtained using a totalizer tag may be more accurate than using other methods.
Configuring totalizer tags is straightforward, but there are many options to choose. This provides great flexibility but can also make the configuration challenging.
Totalizer tags provide an easy way to configure Daily or Monthly totals. The totals can be configured to output one value at the end of the time interval, or to have a running total (ramping total) that outputs an incrementing total until it resets at the end of the time interval.
- A single value per time interval is most useful for long-term reporting. For daily time intervals, the timestamp will be for midnight of the next day, so one day must be subtracted from the timestamp date. For example, a timestamp for a daily total at 5/2/2020 00:00 is the total for the volume that accumulated on 5/1/2020.
- A running total is most useful for displaying on trends or a current value on real-time screens. It will reset at the end of the time interval and start to ramp up again.
PI Asset Framework Analysis Expressions
PI Asset Framework Analysis Expressions is an environment to program scripts with multiple steps, using built-in PE functions and operators. AF executes the calculations using AF attributes or PI Tags as inputs, with the output value of the script mapped to an AF attribute. Analysis Expressions can be configured in an AF element or in an AF template. AF will process the scripts independently from the PI Data Archive using the Asset Framework Analysis services and database, which may be installed on a separate server from the PI system to handle additional load.
Example using the TagTot function to calculate the Daily Total and output to an AF attribute

Trend of Daily Total using AF Analysis Expression to calculate the Daily Total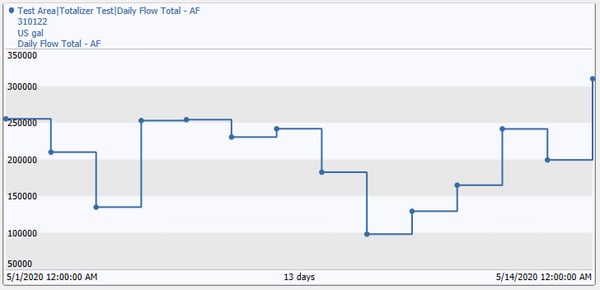
Totalizer Calculation Example
Trend of CDT158, used at flow rate tag in these examples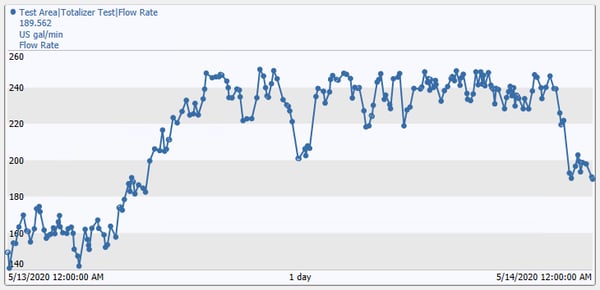
Totalizer Calculation Results for 1 day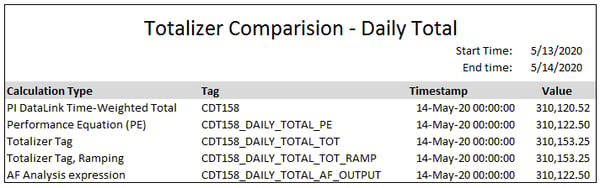
The totalizer comparison above, shows the totalizer calculations for each method, using the PI simulation tag CDT158 as the input. This tag has a compression deviation set to 4 engineering units. Since totalizer tags calculate based on the snapshot data before compression, the totalizer tag result is not equal to the AF calculation result. But the difference is very small, and likely is much smaller than the flowmeter accuracy in real-world applications. If necessary, to improve totalizer calculation accuracy for AF calculations, reduce compression on the input tag.
Give us a call and we can work with you to help bring increased value to your PI Data System and other Historians.
About the Author
Steve has retired from Hallam-ICS, but his contributions to the company continue to be valued.
Read My Hallam Story
About Hallam-ICS
Hallam-ICS is an engineering and automation company that designs MEP systems for facilities and plants, engineers control and automation solutions, and ensures safety and regulatory compliance through arc flash studies, commissioning, and validation. Our offices are located in Massachusetts, Connecticut, New York, Vermont and North Carolina and our projects take us world-wide.


How Do I Set Up Modbus Communication In My Modicon Unity PLC?

6 Steps to Secure Your Industrial Control System

Comments (1)