
by Dan Laird on Sep 24, 2020 10:30:00 AM
Power system harmonics are commonly created by Variable Frequency Drives (VFD’s), Uninterruptible Power Supplies (UPS), computer power supplies, and LED/fluorescent lighting. These devices draw distorted current which in turn distorts to overall voltage waveform. If this distortion is severe enough, equipment failure and nuisance operation of protective devices can occur. How does a user know when this distortion is too severe? IEEE 519-2014 provides the guidelines for assessing harmonics, but this standard is often difficult for users to provide measurements for and interpret. This blog will look at a case study to help clarify how to use data measured on a power meter and compare to the IEEE standard to see if further investigation is warranted.
System Parameters
The R&D Building in this example had a service transformer that was 750 kVA with nameplate 22,860V:480V, Z= 5.5% and grounded-wye to grounded-wye configuration. This transformer was owned by the local utility. The main switchboard was rated 2000A with a 2000A main breaker.
The local utility reported the available fault current to be 4141A on the primary side of their transformer and 15,845A on the secondary side. IEEE 519-2014 would normally define the primary side of the transformer the Point of Common Coupling (PCC) since no other customers are served by this transformer. However, since the owner cannot access the primary side of the transformer, the 480V side of the transformer will be considered the Point of Common Coupling (PCC).
We also need to know the maximum demand current of the system. IEEE 519-2014 requires adding the maximum current at the PCC for each of the past 12 months and dividing by 12. For our system, this works out to approximately 581A.
Voltage Harmonics
A Power Quality Analyzer was installed on the incoming side of the main breaker and recorded data over 1 month in the summer. This analyzer sampled every 200ms and recorded the minimum, average, and maximum values every 10 minutes. IEEE 519-2014 would recommend a longer study, but our goal is only to determine if a more formal study is warranted. This window will show several weekend start-ups during the hottest month of the year when HVAC loading is at its peak. The design requirements voltage distortion limits at the PCC as defined in IEEE 519-2014 are shown below in Figure 1:
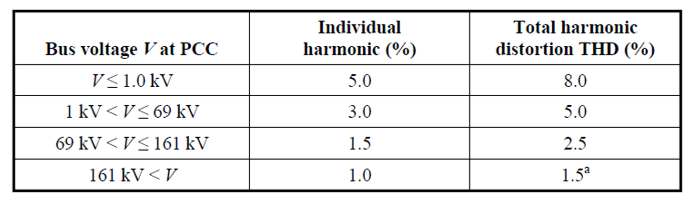
Figure 1 – IEEE 519-2014 Voltage Distortion Limits
Since the R&D Building is a 23kV system, the maximum recommended voltage distortion is 3% for any individual voltage distortion and 5 % Total Harmonic Distortion (THD). As shown in Figure 2 below, the 3rd harmonic has the largest individual distortion but at 2.48% but it is still below the 3% IEEE guideline. The THD during our monitoring window was 2.918, which is also below the IEEE guideline of 5%. We would expect to have such harmonics in a commercial building with fluorescent lighting. There is no cause for concern at these levels of voltage distortion.
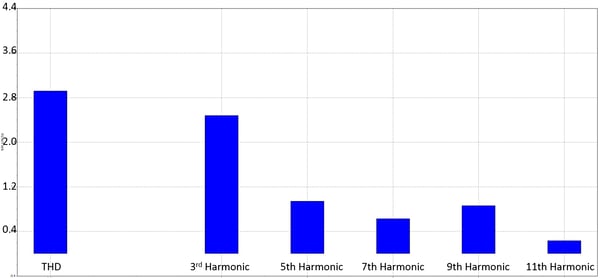
Figure 2 – Actual % Voltage Distortion
Current Harmonics
The design requirements voltage distortion limits at the PCC as defined in IEEE 519-2014 are shown below in Figure 3:
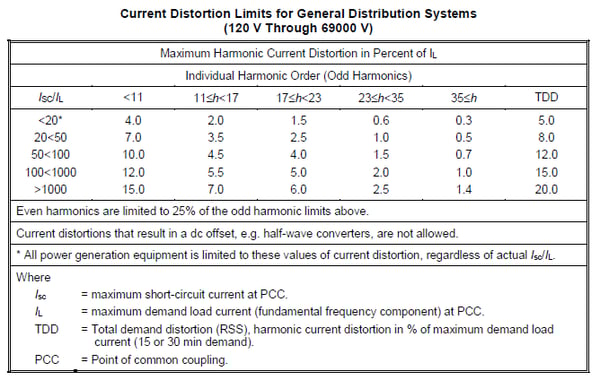
Figure 3 – IEEE 519-2014 Current Distortion Limits
The maximum short circuit current available at our PCC was 15,845A based on the information provided by the local utility. The maximum demand current during the monitoring window was 581A. This creates a worst-case ratio of:
- ISC / IL = 15,845 / 581 = 27
This ratio corresponds to a maximum Total Demand Distortion (TDD) limit of 8% over a 7 day period and where this value is only exceeded during 5% of the measurement period. Unfortunately, most meters only measure Total Harmonic Distortion (THD). The relationship between TDD and THD is:
- TDD = (I1 / IL) THD
Since I1 is the fundamental current measured by the power meter, it will always be less than the maximum load current IL. As a result, TDD levels will be less than THD. Figure 4 below shows the relationship of THD and TDD at the R&D Building during our monitoring window. Note that the average TDD is pretty close to 7% for the monitoring window. Also notice that the THD is highest during the lightly loaded time period on a weekend. The IEEE 519 standard uses TDD so that users are not unfairly penalized for harmonics during periods of light loading such as this.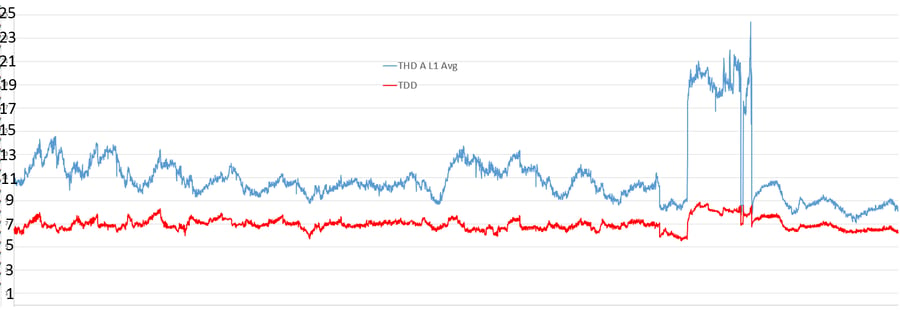
Figure 4 – Actual %THD and %TDD
The IEEE maximum individual distortion for this current ratio is 7% of IL. Since the meter measures harmonic distortion based on I1, the % harmonics in Figure 5 below are not as severe as they appear. However, this graph does illustrate which individual harmonics create the bulk of the distortion seen. The 5th harmonic contributes a distortion equivalent to 9.5% of I1 over our monitoring window. The 7th harmonic contributes a distortion equivalent to 4% of I1 over our monitoring window. The 5th and 7th harmonics are typically the result of 6-pulse VFD’s. These harmonics can be mitigated by series reactors on the VFD’s or by switching some of the 6-pulse VFD’s to 12-pulse VFD’s.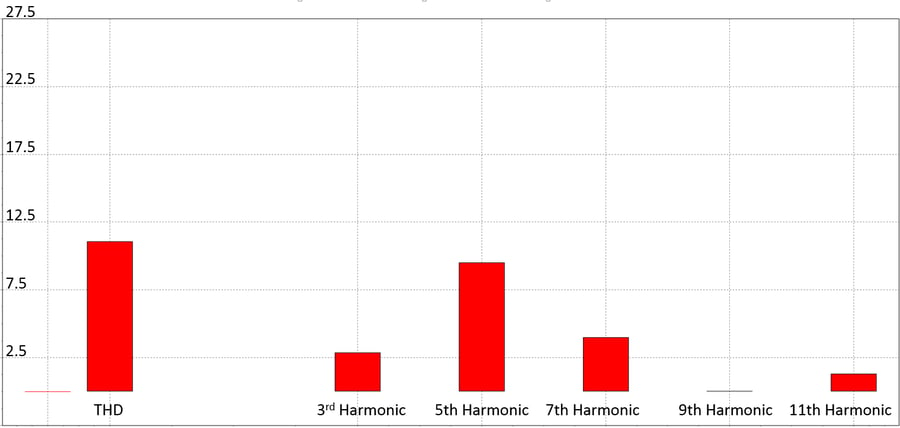
Figure 5 – Individual %Harmonic Contribution to %THD
Conclusions
Utility providers do not enforce harmonic limits unless problems are occurring somewhere in the distribution system. It is also common to record actual distortion in excess of IEEE 519-2014 current guidelines without seeing any operational issues. When operational issues do occur, they typically show up as severe voltage distortion. In the case of this R&D Building, voltage distortion is below the IEEE 519-2014 limits and current distortion is marginally below the IEEE 519-2014 limits for the short time period.
The root cause of the harmonics that are present are most likely 6-pulse VFD’s since the 5th and 7th harmonic measured the highest individual current distortion. Line reactors provide series inductance in front of VFD’s to reduce harmonics. These reactors are typically rated 1%, 3%, and 5%. Figure 6 shown below details the expected current distortion for an individual VFD with various line reactors. The owner may want to investigate what size line reactors, if any, are in service on their larger VFD’s and increase the sizes to further limit current harmonics.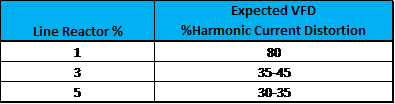
Figure 6 – Line Reactor Distortion Mitigation
Another method for reducing harmonics is to use a harmonic filter tuned to the specific orders causing the distortion. These filters are often used to improve system power factor while avoiding resonance issues associated with fixed capacitor banks. However, since the power factor for the R&D Building was already high, there was little added benefit to using a harmonic filter to justify the higher cost than simple line reactors. These filters can also create leading power factors during lightly loaded conditions or raise the voltage if the system is overcompensated. The recorded current data showed that there was a significant change in load on weekends and evenings which would negatively impact such a filter.
About the author
Dan Laird has left Hallam-ICS to pursue other endeavors, but his contributions to the company continue to be valued.
About Hallam-ICS
Hallam-ICS is an engineering and automation company that designs MEP systems for facilities and plants, engineers control and automation solutions, and ensures safety and regulatory compliance through arc flash studies, commissioning, and validation. Our offices are located in Massachusetts, Connecticut, New York, Vermont and North Carolina and our projects take us world-wide.
How to Deploy a Hach B7000i Total Organic Carbon (TOC) Analyzer

Three Automation Technologies To Look At In 2018

Comments (3)