Equipment Energy Usage – My Favorite MI Project in 2017
by Steve Comeau on Dec 7, 2017 10:00:00 AM

Looking back on 2017, the Manufacturing Intelligence team has worked on many fascinating projects. I would like to tell you about my favorite project for the year, involving collecting data and reporting on equipment energy usage, which is a common need at many facilities.
Visualizing Energy Usage
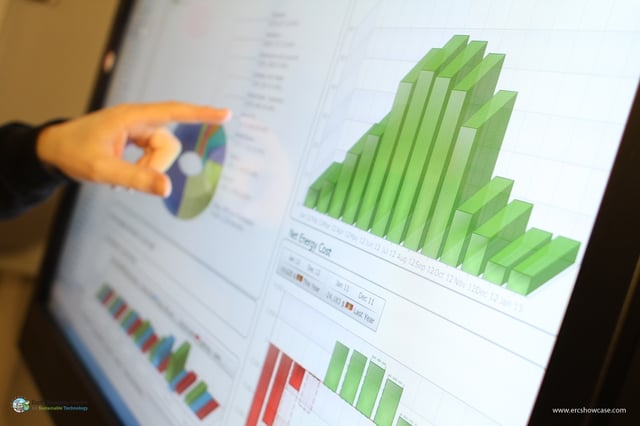
Our client needed a solution to collect and visualize energy usage data on equipment at multiple manufacturing sites. The objective was to get a better understanding of where energy is used, the associated costs, and gain insights into saving energy and money in the manufacturing process. In this case the energy mix was in the form of electricity, nitrogen, compressed air, and natural gas. One problem quickly emerged: although the meters were in place and collecting data, the data was stored in multiple types of databases that could not easily be tied together to obtain data in a similar way. Much of the data is in a historian database, which is great for trending, but much less useful for linking data to contextual information. So we had a problem to be solved! This is of course necessary for any interesting project, particularly one that can be deemed a favorite project of the year.
After multiple meetings with stakeholders to get a thorough understanding of their requirements and design constraints, we settled on designing and building a database in Microsoft SQL Server in the structured as star-schema database. This design would allow users to easily extract useful data when using self-serve business intelligence tools like Microsoft’s Power BI and PowerPivot in Excel, or to quickly build reports using other reporting tools. The energy data was quantized into 15-minute blocks and arranged so that the data can easily be linked to date, time of day, shift, cost, and equipment and product attributes. The data is then easily available for fast reporting and analysis, with associated contextual information that makes it much more useful.
Data Extraction
Of course the data does not magically assemble itself in 15-minutes blocks in a database, so there is work to do to make that happen. The key to this is data extract, transform, and load, or ETL for short. For this we used the Microsoft SQL Server Integration Services (SSIS) software which provides the programming tools needed to perform the necessary ETL tasks, which currently run on an hourly schedule. Data in various forms and complexity and located in many data sources are merged together in a single well-organized database. The users need not care about the originating data sources. Instead they can focus on gaining value from the data using modern BI tools that allow data to easily be explored and visualized in many forms.
This project nicely encapsulates what Manufacturing Intelligence (MI) is all about. MI can bring value to end users because they can have fast and reliable access to plant and facility data that is informative to the business. They can then use this information to measure process improvements that save energy and money.
About the Author
Steve has retired from Hallam-ICS, but his contributions to the company continue to be valued.
Read My Hallam Story
About Hallam-ICS
Hallam-ICS is an engineering and automation company that designs MEP systems for facilities and plants, engineers control and automation solutions, and ensures safety and regulatory compliance through arc flash studies, commissioning, and validation. Our offices are located in Massachusetts, Connecticut, New York, Vermont and North Carolina and our projects take us world-wide.
You May Also Like
These Related Stories
Programming Modicon Ethernet Messaging “The Right Way”

3 Easy Steps to Share Data Between Modicon Quantum PLCs Using Schneider Electric Unity Pro XL


Comments (2)