
by Steve Comeau on Jun 13, 2019 10:30:00 AM
Part one of a five-part series on Manufacturing Intelligence (MI). This is a high-level overview intended for all persons involved in the data stream, including: Automation Engineers, Plant Managers, Data Analysts, and engineers involved in Continuous Improvements and EH & S.
Part 1 - What is Manufacturing Intelligence?
Part 2- Data Sources And Transactions For Manufacturing Intelligence
Part 3- Manufacturing Intelligence - Data Storage
This topic is not limited to manufacturing and is useful for all facilities with a need to collect and use large amounts of automated data.
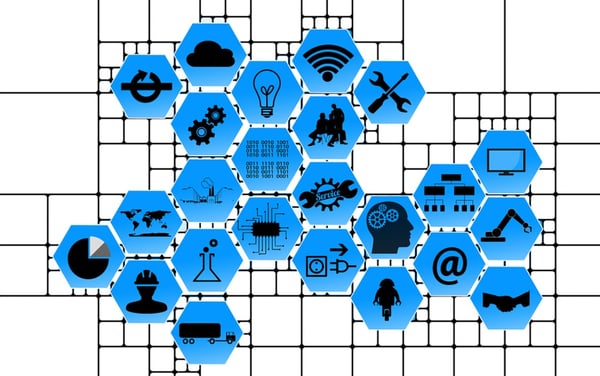
This blog series is about developing the infrastructure and selecting the tools that are needed to get business value from automated data collection at your plant or facility. Manufacturing Intelligence (MI) is the term used to describe the process and the components needed to obtain plant floor data and facility data from many data sources and make it available in a useful form, from the plant floor personnel to the enterprise. That “useful form” can take many shapes, such as being combined with other system data to bring more context to the data; being available in automated reports, visualizations, and data analytics tools; and being summarized and processed into dashboards. The data can also be used to feed machine learning algorithms to provide forecasts and predictive analytics to help optimize your process, provide notifications, and schedule equipment maintenance.
Below is an overview of MI. Depending on your role at your facility, you may be familiar with some part of the MI process, but not all. MI applies to all facilities with data, not just manufacturing plants. In the rest of this blog series, we will delve into the details of each part of MI, which are summarized below.
 Data Sources
Data will be located in many types of devices in a facility or plant. This provides a challenge for obtaining the data since the correct drivers and software are needed to get the data and move it to a database. Here are some examples of devices and software that may have the data you intend to capture and log:
- Networked Devices such as power meters and counters.
- Programmable Logic Controllers (PLC)
- SCADA systems
- Building Automation and Control networks
- OPC Servers
In addition to getting the data from the source, there needs to be a means to log the data to a database based on a trigger or to log data periodically. In some cases, previously logged data records may need to be automatically updated. For this you need a transaction software or data logging software. There are a wide range of choices available, including:
- configurable components in the SCADA system
- custom code in the SCADA system
- data loggers
- transaction managers
- complex MES systems.
We will explore both the data sources and the essential data logging/transaction software in the next blog post in this series.
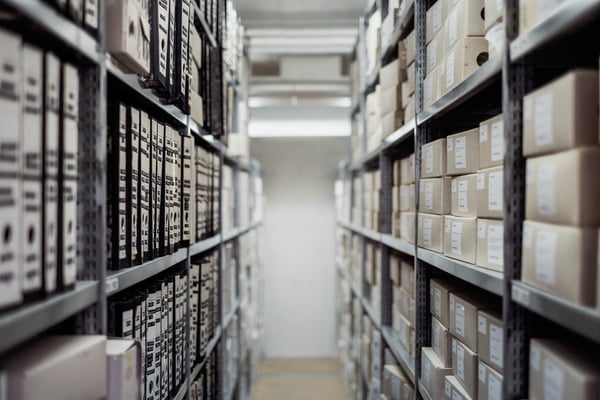 Data Storage
There are two forms of primary data storage that are used:
- Historian databases store data structured in time-series with a tag, timestamp, value, and quality. These databases are suitable for high-speed datalogging and for logging large amounts of process data, such as counts, energy, flows, pressures, and temperatures. Historians are also useful for complex calculations and for framing data in events.
- SQL relational databases store data in related tables. These databases are an especially suited for batch data and for highly-structure data with multiple tables. Many of the common business applications for data analysis and reports are designed to work easily with SQL databases. SQL databases can also be used to log time series data, but performance is best when the sample intervals are long, such a 1 minute or more. For shorter sample intervals, consider using a historian.
Many plant-wide data collection systems use both types of databases as they are not mutually exclusive. We will take a deeper dive into the database architecture in blog post #3 of this series and show the useful features of each database type for securely storing your plant data.
 Database Integration
In many cases, there are requirements to interface with multiple databases or transform data within a database to make it more useful for users. Here database integration is used. Extraction, Transform, and Load routines (ETLs) are used to process data from a data source and send it to a data destination. These can range from relatively simple file read and import scripts to complex code using data integration tools that are designed to read data from multiple sources, aggregate the data, and fill a database designed for efficient reporting.
We will review some of the various scenarios in blog post #4 of this series to show how data integration is used to combine data from various sources and to improve report performance.
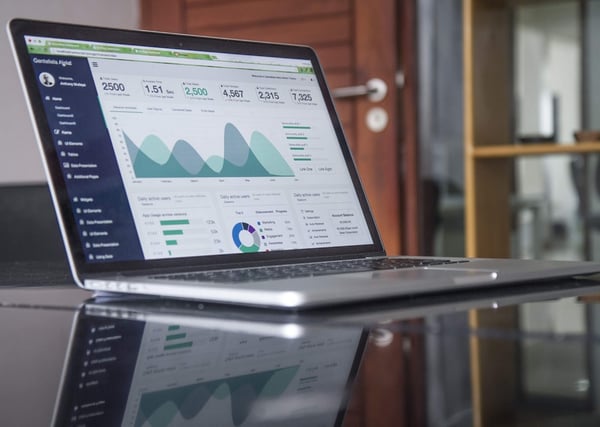 Data Visualization
Data visualization is the part of the system that most people see, and it is the primary end result of all the back-end parts of the system.
There are many choices for data visualization, including:
- Standard Reports, which are easy to run, export data, and automatically generate on a schedule. These are the core data visualization for most users and generally the starting point for most projects.
- Specialized client tools for viewing historian data, such as trends, plant model data, event frames, and real-time data. These also include Excel add-in for generating reports and ad-hoc trends.
- Self-service Business Intelligence (BI) Tools, such as Power BI and Tableau, are used to for a highly interactive user experience, where users can easily query, sort, and group data and various ways. With these tools, users can frequently also build their own reports and dashboards. The tools provide an amazing array of useful charts and visualizations to allows users to interact and get useful information from their data.
- Report portals, which can combine data from many different types of sources into a seamless experience for the users. This is a good solution for larger organizations with many users who need to easily consume the data reports and trends.
In blog post # 5 of this series, we will explore the various choices in data visualizations, the pros and cons of each, and show you how to get the most out of your data resources using visualizations.

About the Author
Steve has retired from Hallam-ICS, but his contributions to the company continue to be valued.
Read My Hallam Story
About Hallam-ICS
Hallam-ICS is an engineering and automation company that designs MEP systems for facilities and plants, engineers control and automation solutions, and ensures safety and regulatory compliance through arc flash studies, commissioning, and validation. Our offices are located in Massachusetts, Connecticut, New York, Vermont and North Carolina and our projects take us world-wide.


Equipment Energy Usage – My Favorite MI Project in 2017
Why is Infrared Thermography Important for Electrical Equipment?
No Comments Yet
Let us know what you think