PROCESS CONTROL SYSTEMS
ADVANCING MANUFACTURING WITH AUTOMATION
Building, improving, or maintaining control systems requires deep knowledge of complex control systems and client service. Whether you’re ramping up semiconductor production to keep up with demand or assembling highly-regulated medical devices, you need an experienced automation partner you can trust to minimize production downtime and deliver a robust, flexible process control system on-time and on-budget.
PROCESS CONTROL SERVICES
Grow your business with stellar process control. We excel at delivering cutting-edge control systems tailored to the needs of industries like life sciences, semiconductors, food and beverage, among others. With a team of seasoned automation experts, we provide comprehensive solutions—from electrical design to process automation and cybersecurity. Our holistic approach ensures seamless project execution, minimizing downtime and maximizing efficiency. We are committed to delivering robust, reliable systems that adhere to the highest industry standards, ensuring your operations run smoothly and securely. Our turnkey services provide low-maintenance automation, allowing you to focus on what you do best.
PLC + SCADA PROGRAMMING
PLC + SCADA PROGRAMMING
MANUFACTURING INTELLIGENCE
MANUFACTURING INTELLIGENCE
INSTRUMENTATION + CALIBRATION
INSTRUMENTATION + CALIBRATION
UL CONTROL PANEL FABRICATION
UL CONTROL PANEL FABRICATION
OT NETWORKING + CYBERSECURITY
OT NETWORKING + CYBERSECURITY
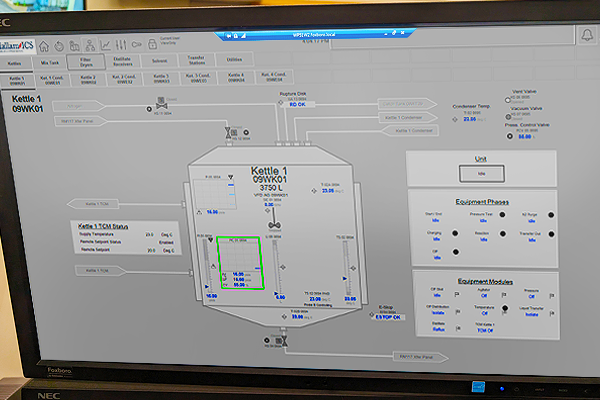
PLC + SCADA PROGRAMMING
Our PLC + SCADA programming services ensure seamless automation and control of your industrial processes. We excel in HMI/SCADA programming, ensuring intuitive and efficient human-machine interfaces. From system design to start-up and validation, we ensure your control systems are robust, reliable, and compliant with industry standards, enhancing operational efficiency and reducing downtime.
Hallam’s PLC & SCADA programming services include:
- GAMP Specification Development
- Control System Design
- PLC/PAC/DCS Programming
- HMI/SCADA Programming
- System Installation
- Start-Up and Validation
MANUFACTURING INTELLIGENCE
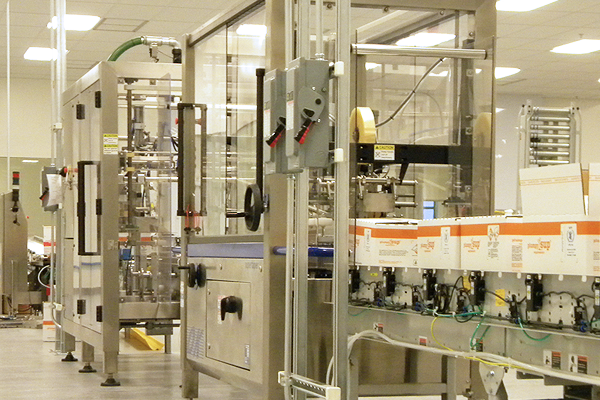
Our manufacturing intelligence services enhance productivity and help you maintain a competitive edge by leveraging your data. We provide a variety of development and integration services to capture and analyze critical process data. Gain actionable insight through reports and dashboards, while data analytics help you optimize processes, reduce costs, and improve decision-making through operational efficiency.
Hallam-ICS’s manufacturing intelligence services include:
- Database Design and Integration
- Historian Installation and Configuration
- Application Development
- Reports and Dashboards
- Data Analytics
- Front Office Systems Integration (e.g., SAP)
- Manufacturing Execution System (MES) Development and Deployment
- Overall Equipment Efficiency (OEE)
- 21 CFR Part 11 Applications
INSTRUMENTATION + CALIBRATION
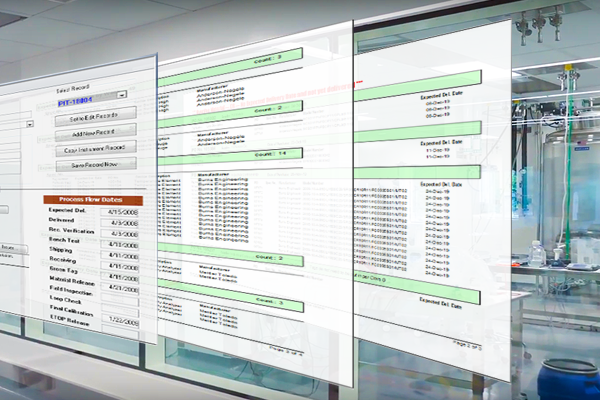
Our instrumentation and calibration services provide precise control and measurement solutions for your processes. With turnkey solutions, our experts handle installation and calibration, delivering a thorough equipment turnover package to ensure product quality through accurate measurements, reliable performance, and compliance with industry standards.
Hallam-ICS’s instrumentation + calibration services include:
- Main Instrument Vendor
- Instrument + Valve Specification
- Procurement, Receiving + Bench Testing
- Installation
- Calibration
- Equipment Turnover Package
UL CONTROL PANEL FABRICATION
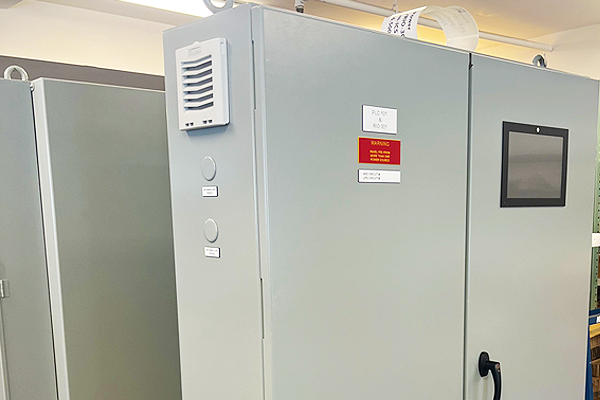
Our UL control panel fabrication services cover everything from design to production. We perform rigorous factory acceptance testing to ensure panels meet the highest standards of quality and safety. With expertise in process control, power distribution, and monitoring, our custom-fabricated panels are designed to enhance operational efficiency and safety.
Hallam-ICS’s UL control panel fabrication services include:
- UL Control Panel Design
- UL Control Panel Fabrication
- Factory Acceptance Testing
Our panel certifications include UL508A, UL698A, and UL NNNY.
OPERATIONAL TECHNOLOGY (OT) NETWORKING + CYBERSECURITY
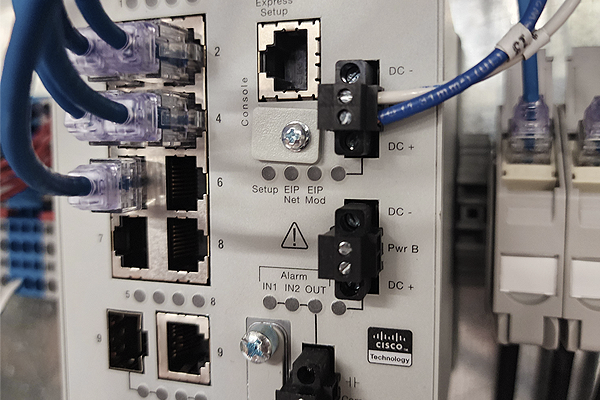
Our operational technology (OT) networking and cybersecurity services safeguard your infrastructure. We design and implement secure networking solutions that protect your systems from cyber threats and ensure reliable communication across all devices. By securing your OT environment, we help you maintain continuous operations, protect sensitive data, and comply with regulatory requirements, providing peace of mind and operational resilience.
Our OT networking + cybersecurity services include:
- OT Network Design + Configuration
- OT Network Troubleshooting and Discovery
- OT Networking + Cybersecurity Auditing
- Remediation Services
- On-going Monitoring + Support
WHY HALLAM-ICS?
Providing Turnkey Process Control Systems
Our tailored approach allows us to serve as an extension of your team to deliver turnkey process control systems. We will design, build, and program a system you can use on day one with minimal downtime. We've handled turnkey projects from $250k-$25M.
30+ Years of Automation Expertise
With more than three decades of process control experience, we’ve helped hundreds of clients improve their production throughput with process automation systems. From control system integration to calibration and manufacturing intelligence, our process control services will optimize your operations.
Deep Technical and Process Knowledge
At Hallam-ICS, our comprehensive understanding of manufacturing processes and our deep technical knowledge allow us to tailor automation solutions to your needs. We take an unbiased approach and recommend only the best technology platform for your application.
Providing Safe Solutions
Our team has a comprehensive understanding of UL, NEC, NFPA, and ACGIH safety requirements. Whether your facility is a non-hazardous environment or Class 1 Div 1, we provide factory monitoring and control system panels that prioritize the safety of your personnel and operations.
RELATED RESOURCES
Explore our library of resources to learn more about our exceptional engineering solutions in a variety of applications.
CASE STUDY
Instrumentation and Metrology for Over 400 Instruments

CASE STUDY
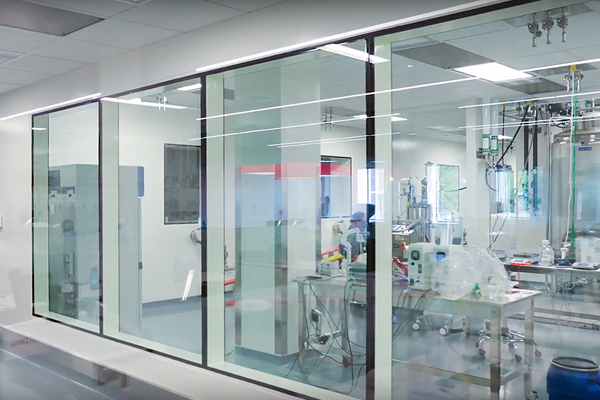
Installation and Calibration for cGMP Environment

CASE STUDY
Data System for Reporting, Trending & Analysis using OSIsoft PI System

CASE STUDY
Upgrading Control System on a Running Central Utility Plant

CASE STUDY
Data Analytics to Obtain Production Line Run Rates for Scheduling

CASE STUDY
Overall Equipment Effectiveness System
CASE STUDY
Non-Dairy Equipment Installation

CASE STUDY
Process Control System in Accordance with S88 Batch

CASE STUDY
System Documentation Migration from Legacy to Modern

CASE STUDY
New Manufacturing Facility Instrument Calibration

CASE STUDY
Process Instrumentation Installation and Management

CASE STUDY
Instrumentation Lead
SUCCESS WITH HALLAM-ICS
Clients across industries benefit from our engineering expertise, responsiveness, and project management.
Frequently Asked Questions
Expect clean, version-controlled documentation: I/O lists, control narratives, network drawings, panel schedules, alarm matrices, source code repositories, FAT/SAT records, and operator training materials - organized for maintenance and audits.
A true turnkey scope from the Hallam-ICS integration team typically includes PLC programming, SCADA/HMI development, instrumentation and controls design, OT Network architecture design, UL panel fabrication with FAT/SAT, onsite commissioning/startup, and documentation/training - delivering one accountable partner from design through operation.
Yes. Hallam-ICS designs and fabricates UL-listed control panels in-house. Each panel undergoes a comprehensive Factory Acceptance Test (FAT) prior to shipment to verify wiring integrity, I/O functionality, and conformance with the project’s functional requirements. Our team then performs Site Acceptance Testing (SAT) and commissioning onsite to validate performance under real operating conditions.
Absolutely. Hallam-ICS engineers specialize in modernizing legacy PLC, HMI, and SCADA systems, including major migrations such as Allen-Bradley PLC-5 to ControlLogix, SLC to CompactLogix, and transitions from outdated HMI/SCADA platforms to Ignition, FactoryTalk, VTScada, and others.
We employ proven strategies such as code conversion tools, simulation/emulation, digital twins, and staged cutovers to minimize downtime and reduce implementation risk allowing production to stay online while systems are upgraded.
Hallam-ICS applies a defense-in-depth methodology to protect operational technology environments. Our designs incorporate secure network segmentation, role-based access control, system hardening, audit/logging frameworks, and structured patching and backup strategies. We also apply standardized control panel, software, and configuration practices to reduce attack surface and ensure long-term maintainability.
All cybersecurity measures are aligned with your corporate IT/OT policies and integrated into the overall turnkey control system delivery to ensure a secure, compliant, and resilient architecture.
Hallam-ICS supports a broad range of leading control and SCADA ecosystems. Our engineers work extensively with major PLC platforms including Allen-Bradley, Siemens, and Schneider/Modicon. We also design, develop, and deploy systems using top SCADA and visualization technologies such as Ignition, FactoryTalk, Wonderware, VTScada, and more.
Hallam-ICS is a Rockwell Silver-Level System Integrator, certified in Control, Visualization, Low Voltage Drives, and Process (including Batch and PlantPAx). We are also a Premier-Level Integrator for Inductive Automation Ignition.
We select and apply platforms based on your standards, operational goals, and long-term lifecycle requirements, ensuring the right technology foundation for your facility.
Yes. Hallam-ICS engineers architect and implement FMCS/SCADA systems that tightly integrate facility infrastructure monitoring with process control environments. Our solutions support unified data acquisition, event/alarm management, and coordinated control strategies across HVAC, utilities, environmental/critical monitoring, and production automation systems.
We leverage open industrial protocols (e.g., BACnet, Modbus TCP, EtherNet/IP), secure OT network segmentation, and standardized data models to ensure reliable interoperability between disparate systems. This integrated architecture enhances system diagnostics, streamlines operational workflows, and improves overall resiliency in mission-critical applications.
Yes. Our integration team specializes in Life Sciences/Pharma, Semiconductor, Food & Beverage, and Industrial Process and Manufacturing, with project experience ranging from batching and cleanroom utilities to facility monitoring and sort/packaging automation.
Modern process control systems enhance efficiency by automating critical operations, standardizing workflows, and providing high-resolution production data. Robust PLC/SCADA architectures reduce unplanned downtime, increase throughput, and deliver consistent product quality by ensuring precise, repeatable control.
Hallam-ICS control integration engineers optimize control sequences, alarm management strategies, and historian/reporting infrastructure to improve situational awareness. These tools enable operations teams to quickly identify bottlenecks, analyze performance trends, and implement sustainable process improvements.
OUR TAILORED APPROACH
Whether you are a semiconductor manufacturer, life sciences company, or industrial plant, our tailored approach ensures that our solutions are perfectly aligned with your unique requirements and timeline. At Hallam-ICS, our approach is rooted in a culture that values collaboration, meticulous attention to detail, and an unwavering commitment to safety. Our team’s engineering expertise and ability to tailor our services to different industries and needs sets us apart, making us a trusted partner in achieving your operational goals.
We follow our proprietary CODES™ process — COMMUNICATIONS, OVERSIGHT, DOCUMENTATION, EXPECTATIONS, and SCHEDULE — to deliver exceptional project quality and consistency. Each project starts with a comprehensive discovery phase, when we gather critical information about your needs and milestones to develop a customized project plan that ensures seamless execution. Throughout the project, we maintain open lines of communication and provide detailed documentation, ensuring that every phase is meticulously managed. Our commitment to technical excellence, combined with our robust customer service, guarantees a successful project outcome and an exceptional customer experience.


FROM OUR BLOG
Stay updated with the latest insights, trends, and expert engineering advice on our blog.

Emerson Ultrasonic Flow Meters: Installation Guide and Data Insights
How Emerson Flow Meters and Ignition Dashboards Drive Efficiency


.png?width=1400&height=800&name=Keys%20to%20successful%20instrumentation%20project_LI%20(2).png)
